
One of the tasks during Phase I flight testing is to determine the significant flight speeds. Things like Vx (best angle of climb), Vy (best rate of climb) and Vso (stall speed in landing configuration).
Stall speed is easy… especially in the Velocity. Just keep going slower and slower until the canard stalls.
The climb speeds were a bit of work though. Basically you pick a starting altitude (I chose 4,000′) and then get into a full power climb at a defined airspeed before hitting that starting altitude. Then hold that airspeed for one minute and see how much altitude you gained.
Repeat for at least four airspeeds. I chose 70, 80, 90 and 100kts. Then take those results and plot them on a graph. On most conventional aircraft you end up with a pretty bell curve. The peak of the curve is your best rate of climb. Then you draw a line from 0/0 to where it just meets the curve and the point it touches is your best angle of climb.
Normally, it looks like this:

It this example, Vy would be about 86kts and Vx would be 80kts.
But the Velocity is anything but normal.
Here’s the chart I ended up with:
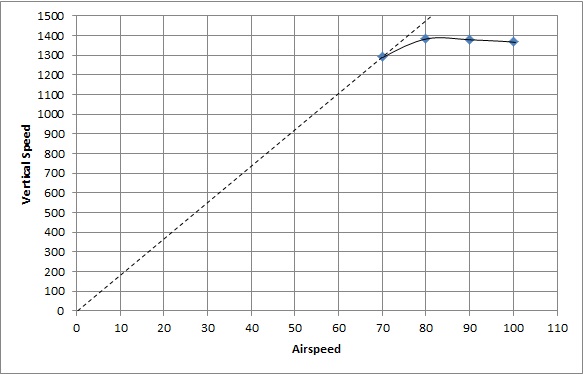
Not exactly what you would call a bell curve, huh?
For Vy, 80kts gave me the best rate of climb at 1,386fpm. But there’s almost no forward visibility at 80kts since it feels like you’re looking straight up. And it’s about 20kts above the canard stall. And finally, 90kts is only 10 feet per minute slower. 100kts is only 4fpm slower than 90kts. So I like 90kts as Vy.
Vx is real tough. I could run another flight test and see where 60kts comes in on the graph, but I don’t think I would like the deck angle or being that close to the stall speed at that angle. So I would be happy saying that Vx is 70kts.
Except that I don’t like the idea of flying at that angle. And because I have all the data being recorded, I was able to determine the deck angle and the distance covered during the climb. The deck angle really isn’t significant since what you’re really trying to do is get as high as possible over a given distance. What I discovered is that the distance covered for 1,000 feet of altitude gained is:
70kts: 1.069nm
80kts: 1.082nm
90kts: 1.233nm
100kts: 1.532nm
While 70kts is obviously a better climb angle, 80kts provides the same altitude gain with only an additional 80 feet of distance.
So for me, 80kts is now the official Vx.
And if I’m ever in a situation where I REALLY need to get higher in the shortest possible distance, I know that 70kts will get me over that mounding pile of zombies. I just need to watch the CHT’s and make sure I don’t get any slower.
Even though this was done during Phase I Flight Testing, I wanted to lay the groundwork for some recent testing.
Foreflight recently added a feature where it draws a line around the plane that shows how far you can glide (it factors in terrain and winds). In order to use this, you have to know the glide ratio. During Phase I, I figured the best glide speed (basically, minimum sink rate), but didn’t know what the glide ratio was.
I did some research and discovered what glider guys have known for years. The Polar Glide Chart. Basically, this is the same chart that I used to determine the climb speeds. It’s just inverted. Now the glider pilots take this way deeper than I need to go, but the concept is the same. Pick a starting altitude, fly a decent at a constant speed, then after 1 minute record the altitude lost. Go back up and repeat at another three airspeeds. I used 5,000′ as my starting altitude and 100, 90, 80 and 70KIAS for airspeeds. Like I did with the climb tests, I did all the descents in the same direction in roughly the same place, this way I could use the flight data recorder to also determine distance.
Here’s what a chart would look like for a traditional airplane:
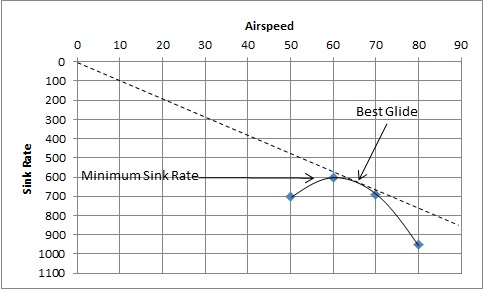
Here we can see the airspeed which gives you the minimum sink rate (or most time in the air) is about 62kts. The airspeed which would provide the greatest distance looks to be about 65kts. I can’t find any official designations for these airspeeds. I’ve found Vld which is supposedly the best “Lift to Drag ratio” so that sounds like minimum sink rate. And I’ve seen some references to Vbg which is supposed to be “Best Glide”. So I’ll use those. If anyone knows the official terms, please let me know.
Now for the results of my recent testing.

Not very different from the climb chart.
In this case, the sink rate decreases the slower you fly but starts to flatten out at about 70 knots. But it’s not about staying in the air longer. You also need to cover ground.
For distance, it looks like about 88kts would give the best glide distance at 12.15:1.
So in the interest of simplicity, I’m going to call 90kts Vbg.
Now in the real world, if the engine ever stops, the glide ratio will increase since there will not be the drag from the windmilling prop. Not sure how much it will improve the ratio, but more is usually better, right?